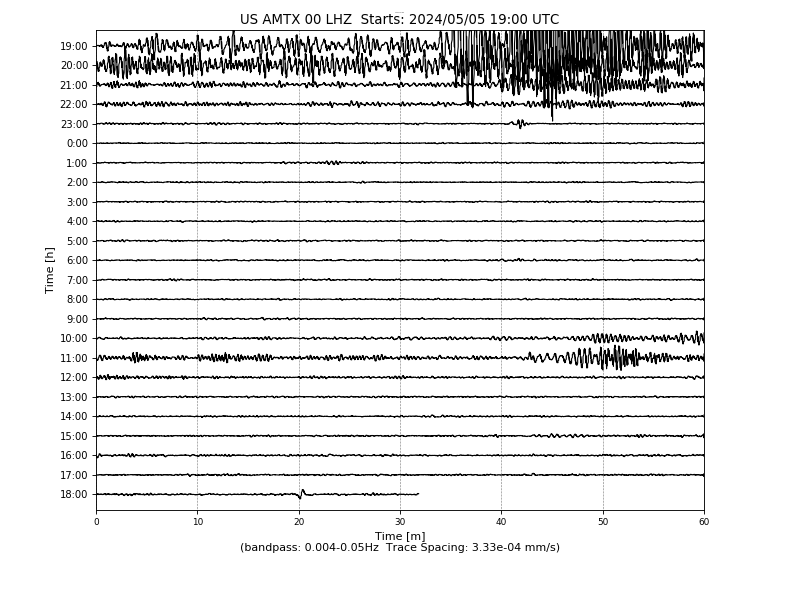
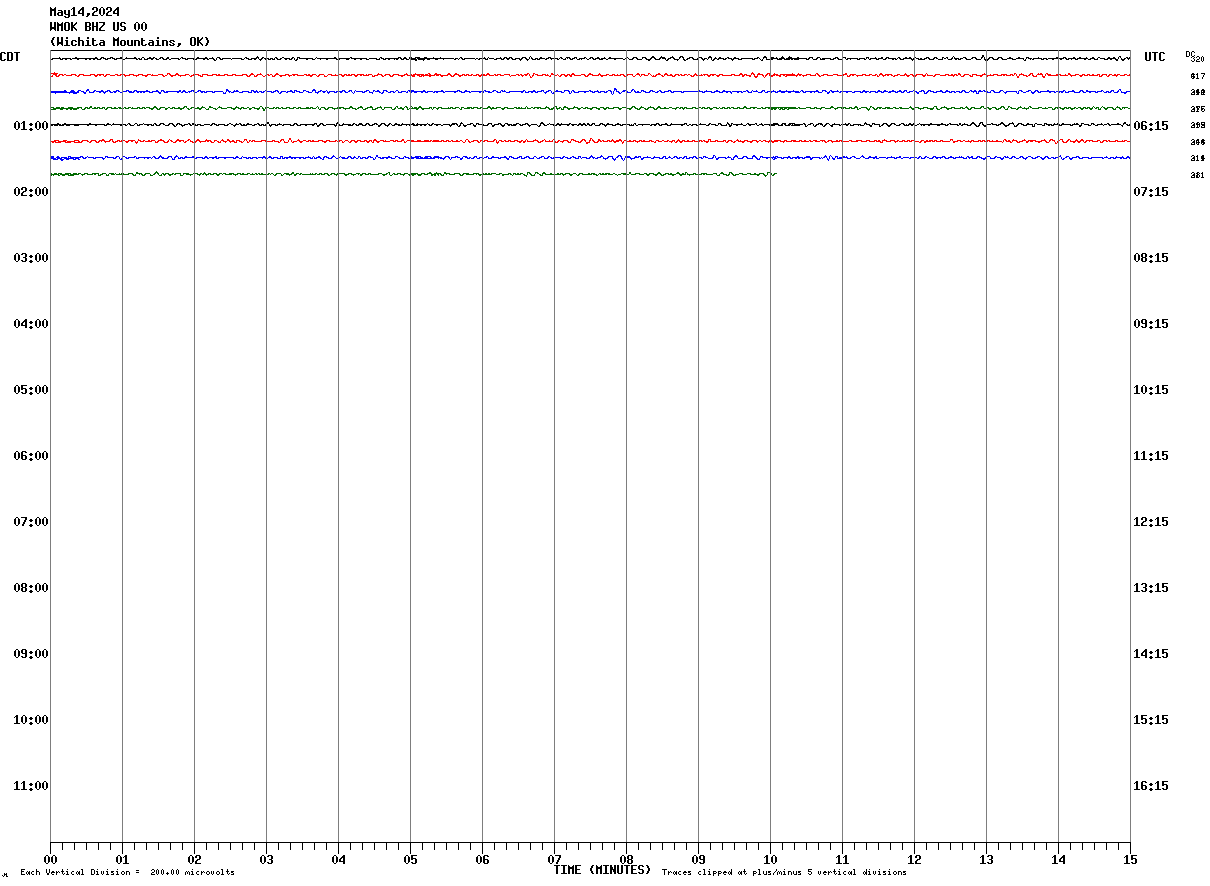
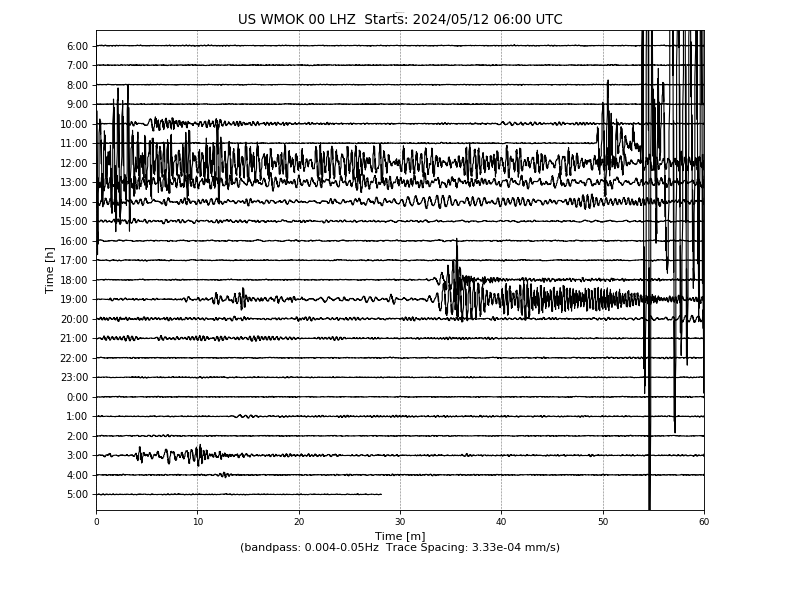
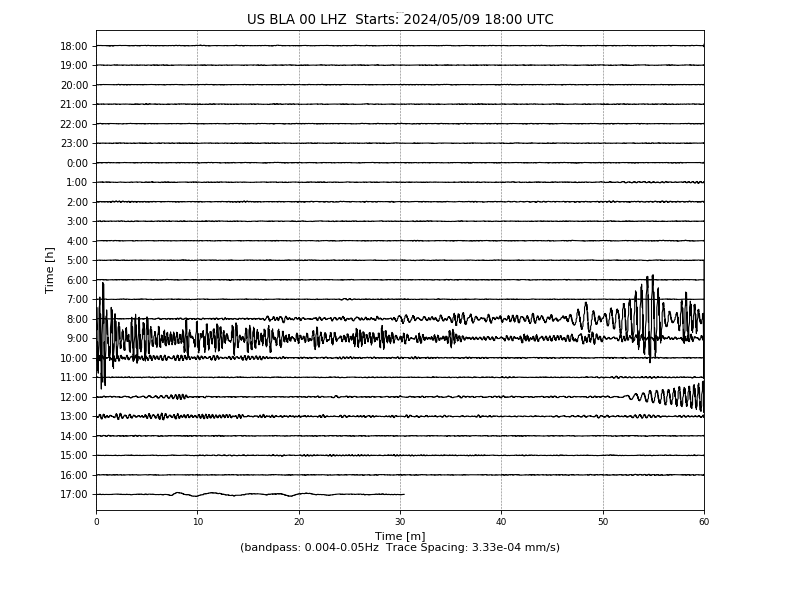
The following heliplots show current BHZ and LHZ seismographs for a few locations around the United States.
The BHZ heliplots are better at showing seismic events that are close to the seismometer, usually in the same
or a nearby state. The LHZ heliplots are better at showing seismic events that happen far away from the
seismometer, typically any large event that happens outside the United States.
Those 3 letter codes indicate what type of seismometer is in use and which seismic frequencies are being measured.
B means the instrument is recording Broad Band frequencies with a sample rate between 10 and 80 Hz.
L means the instrument is recording Long Period frequencies with a sample rate of approximately 1 Hz.
H means the instrument is a High Gain Seismometer.
Z means the instrument is recording displacements in the Vertical direction.
Current time in UTC: 2025/04/19 13:37:12 Saturday (Click on an image to see it full size)
Click on a Station ID to see its last 4 BHZ heliplots.
These heliplots are provided by the Center for Earthquake Research and Information (CERI) and
the United States Geological Survey (USGS). If you would like to see heliplots for
other locations, you can choose a station from the USGS Advanced National Seismic System (ANSS),
or you can choose a station from the USGS Global Seismographic Network (GSN). Also, you can visit
CERI and choose a station from one of their station lists
or their station map.
If any of the heliplot links are broken, or if there is no data in a particular heliplot, then there may be a problem or outage at CERI or the USGS. If there is a problem, please visit CERI or the USGS for further details.
B means the instrument is recording Broad Band frequencies with a sample rate between 10 and 80 Hz.
L means the instrument is recording Long Period frequencies with a sample rate of approximately 1 Hz.
H means the instrument is a High Gain Seismometer.
Z means the instrument is recording displacements in the Vertical direction.
Current time in UTC: 2025/04/19 13:37:12 Saturday (Click on an image to see it full size)
Click on a Station ID to see its last 4 BHZ heliplots.
| Station ID | BHZ Heliplots | LHZ Heliplots |
|---|---|---|
| AMTX Amarillo, TX |
 |
 |
| WMOK Wichita Mountains, OK |
 |
 |
| MIAR Mt. Ida, AR |
 |
 |
| OXF Oxford, MS |
 |
 |
| ERPA Erie, PA |
 |
 |
| BLA Blacksburg, VA |
 |
 |
If any of the heliplot links are broken, or if there is no data in a particular heliplot, then there may be a problem or outage at CERI or the USGS. If there is a problem, please visit CERI or the USGS for further details.
